Mapping Apex Electrofisher Data
Improve your presentations, reports, and standardization by mapping your Apex Electrofisher data.
Whether you are using the Apex Backpack Electrofisher or the Apex Electrofishing Control Box for boats, your equipment automatically records useful data while you actively electrofish.
To download the data from your Apex Electrofisher, simply turn the electrofisher on, unscrew the cap from the USB port, and insert a USB drive. The Apex electrofishing equipment will automatically download the data onto your USB drive.
The downloaded folder will contain 5 files:
- Trends file contains a record of every second of active electrofishing, including time (UTC), date, elevation, GPS, accuracy of GPS, timer, current, voltage, power, duty cycle, frequency, etc. See the list at the end of the article for all the variables.
- Faults file contains all of the warnings and errors logged by the equipment. This information is very helpful when contacting Smith-Root to diagnose any potential issues.
- Events file contains information about when the equipment was tested, as well as any hardware, firmware, and software updates.
- SQLite file that can be used in a database engine. This is used by our technicians when the equipment is sent in for repair.
- Readme file that offers information on the variables recorded in the Trends file. (See end of this article for this information).
The Trends, Faults, and Events files are all downloaded as .CSV files. These can easily be opened on your computer in a spreadsheet program, like Microsoft Excel.
To map the data from the Trends file, follow the instructions offered in the video below.
Here are some helpful hints you should consider prior to mapping:
- The easiest and most visually compelling tool we have found to map your data is Google Earth Pro, which can be downloaded for free.
- Before uploading the trends file into Google Earth Pro, save the file as a “tabs delimited text file”.
- Consider saving text files as smaller time segments (i.e. days, transects, sites, etc.) to prevent Google Earth Pro from being overwhelmed by large data sets.
- In Excel, graph the variable you will be using to color code the dots in your map to best determine the numerical brackets you will use in Google Earth Pro for each color.
Once you have your maps, consider looking for some of the following trends:
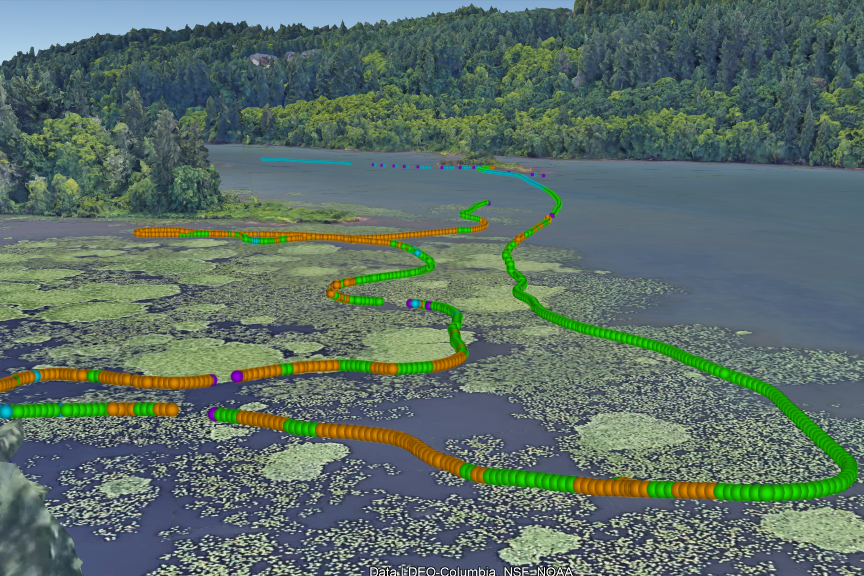
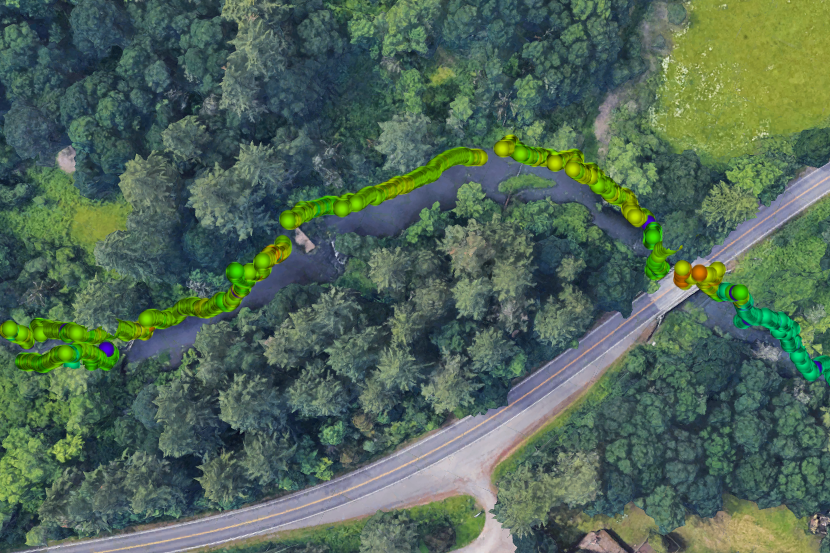
- When electrofisher settings are kept the same across a transect, they tend to output more electrical current (amps) and power (watts) in deeper water, when the electrodes are moved closer to each other, and around metal structures because of the reduced resistance in these situations.
- Mapped dots that are closer together indicate that the electrofisher is moving slower, whereas dots that are more spread out indicate that the electrofisher was traveling faster.
- Gaps in the dots on the map indicate where the user did not activate the output switch on the electrofisher.
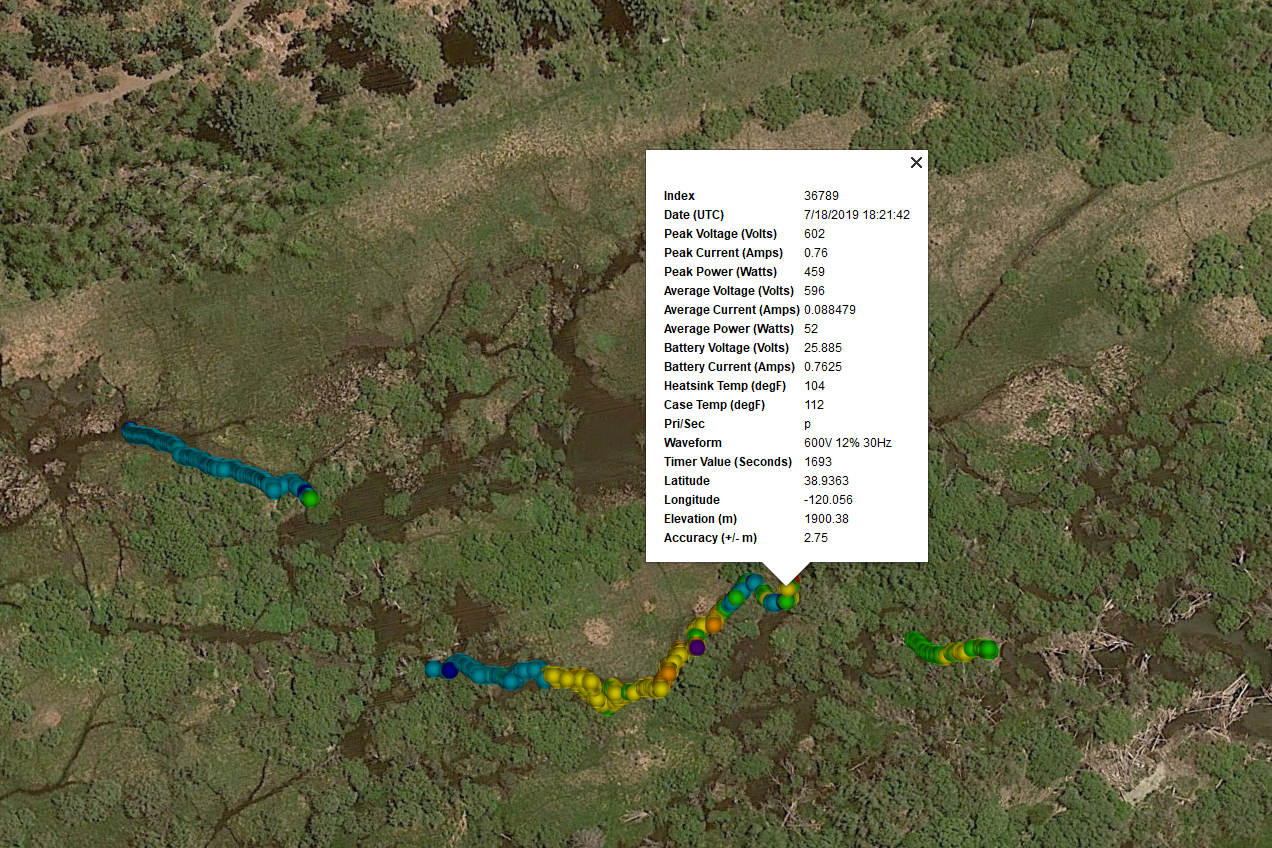
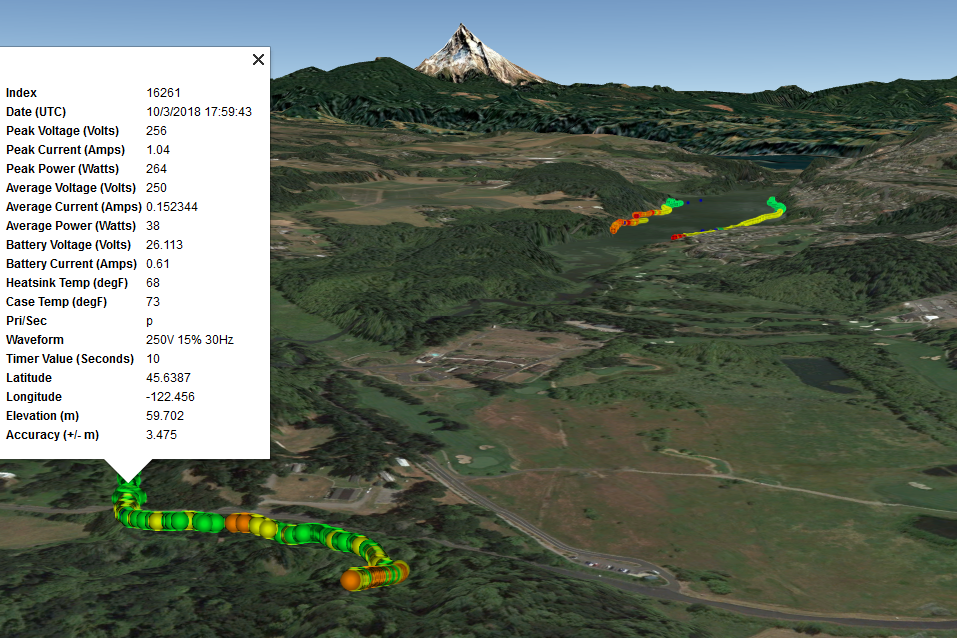
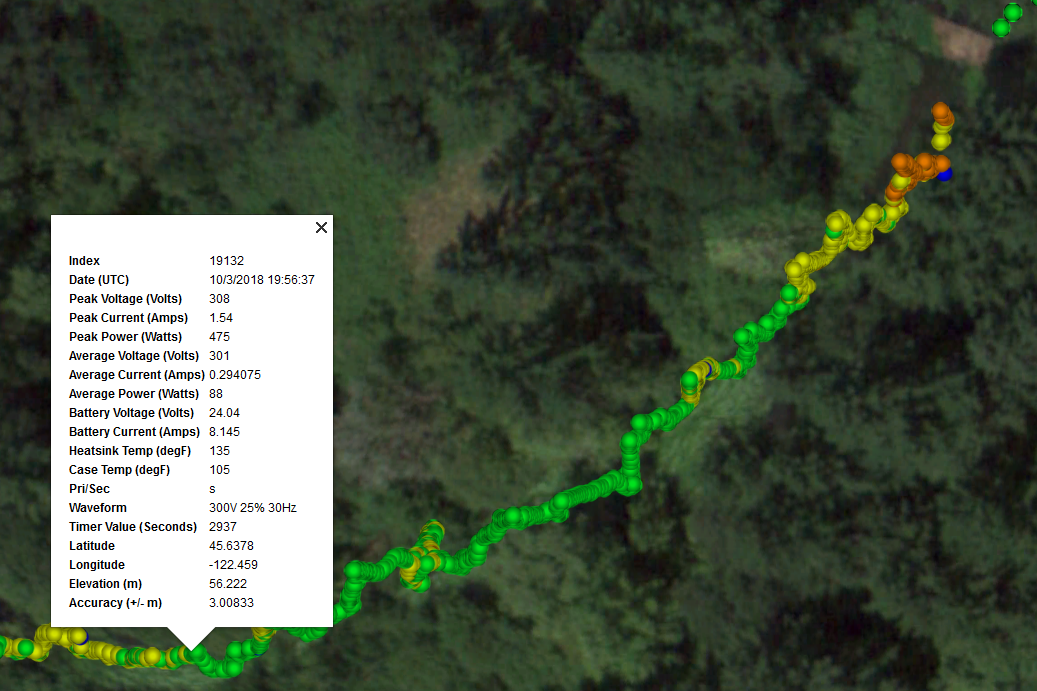
- Hovering over a single dot with your pointer while in Google Earth Pro will display all of the data for that particular point in time.
- Standardization of electrical outputs has been a major focus of electrofishing practices. As you can see from your map, it can be difficult to achieve 100% standardization because your environments are dynamic. These data and maps will help you understand the variability of your electrofishing outputs and provide optimal opportunities for standardizing as best you can as you better understand the factors at your field sites that impact your electrical outputs.
Please .(JavaScript must be enabled to view this email address) if you have any questions about data, mapping, interpreting your maps, or downloading data from your equipment. We look forward to seeing all of the awesome maps you create and use to improve your electrofishing practices.
Below is the Read Me file for the Apex Boat Electrofisher Control Box:
| Field | Value |
|---|---|
| Date | Timestamp in yyyy-mm-dd hh:mm:ss UTC format. To convert to local time, add your UTC offset and, if necessary, account for daylight saving. |
| Peak Voltage | Peak output voltage in Volts. Normally a pulse will start with a high peak voltage and the voltage will decrease as the internal capacitors drain. |
| Peak Current | Peak output current in Amps. Normally a pulse will start with a high peak current and the current will decrease as the internal capacitors drain. |
| Peak Power | Peak output power in Watts. |
| Average Voltage | Average voltage in Volts. In AC mode, this is an RMS calculation.
An average voltage value that is significantly less than the peak voltage indicates a heavy load or a long output pulse. |
| Average Current | Average current in Amps. In AC mode, this is an RMS calculation. |
| Power | Power in Watts. In AC mode, this is an RMS calculation. |
| Input Voltage | Input voltage in Volts. |
| Input Current | Input current in Amps. |
| Input Power | Input power in Watts. |
| Status | Status flags. A list of flags that represent the operating state of the unit. If a flag is present, the unit is running with the corresponding condition.
Flags: p = Primary waveform. s = Secondary waveform. t = High temperature warning. g = Generator over power. a = High output amps warning. r = Changing voltage ranges. For example, a status entry of “pg”, indicates the unit is running the primary waveform and the generator is over power. |
| Waveform | Active waveform.
Pulse format: [voltage]V [duty cycle]% [frequency]Hz Example: 100V 10% 10Hz Burst format: [voltage]V [duty cycle]% [frequency]Hz ×[burst pulses] [burst frequency]Hz Example: 100V 10% 10Hz ×3 50Hz DC format: [voltage] VDC Example: 100 VDC AC format: [voltage] VAC Example: 100 VAC |
| Timer | Elapsed run time since last timer reset in seconds. |
| Board Temperature | Internal components temperature in degrees Celsius. |
| Latitude | Latitude in decimal degrees. |
| Longitude | Longitude in decimal degrees. |
| Elevation | Elevation in meters. |
| Accuracy | Positional accuracy of latitude, longitude, and elevation in meters. |